
1: Analytical Concepts & Statistics
- Define analytical terminology (e.g., blank, matrix, analyte, assay, quantitative, qualitative)
- assay: is process of determining the amount of analyte (substance being measured) in sample
- analyte: the substance being measured
- qualitative analysis: (identification)
- quantitative analysis: (quantity)
- sample matrix: everything but the analyte
- blank: chemist made sample that lacks analyte
- solvent: same solvent as sample solutions
- method: same solvents and reagents
- sample: tries to approximate the sample matrix, everything but analyte
- Describe figures of merit and use them to characterize and compare methods.
- LOD, LOQ
- accuracy & precision
- selectivity
- interferent: chemical that causes systematic error in measured quantity
- masking agent: prevents components in sample matrix from interfering with analysis
- analytical method
- interference with analyte: analyte binds with matrix
- interference with reagent: matrix binds with reagent
- background interference
- sensitivity: determined by slope (how small of a change can be measured)
- range: concentration range where we have good linearity, accuracy, precision
- dynamic range: range instrument can measure
- robustness: ability of method to withstand small, uncontrolled changes in operation parameters
- Identify potential challenges related to sample collection and preparation.
- Calculate the detection limit.
- noise: random fluctuations in measured signal
- blank: a constant (like control) signal measured in absence of analyte
- limit of detection (LOD): smallest concentration of absolute amount of analyte with signal much larger than blank
- (signal) LOD: units as signal (instrument maker) Smb + zσmb
- (sample) LOD: amount/concentration (user)
- calibration curve: σDL = 3σmb/m
- Differentiate between random and systematic sources of uncertainty (error) and explain how repeated measurements can help reduce uncertainty.
- absolute error: x̄ − μ
- relative error: $$\frac{\bar{x} - \mu}{\mu} \times 100 \%$$
- random uncertainty: can’t replicate, contributes to imprecision => quantify with stats
- systematic uncertainty: contribute to inaccuracy, repeats, can correct for
- proportional error: %, issue for large signals
- constant error: always some absolute value, issue for small signals
- Describe how the sample matrix can affect measurements.
- matrix effects: combined effect of non-analyte components in sample on measurement of analyte
- Explain the 3 methods of calibration: external standards, standard addition and internal standards
- external standard: series of solutions of known concentration of analyte
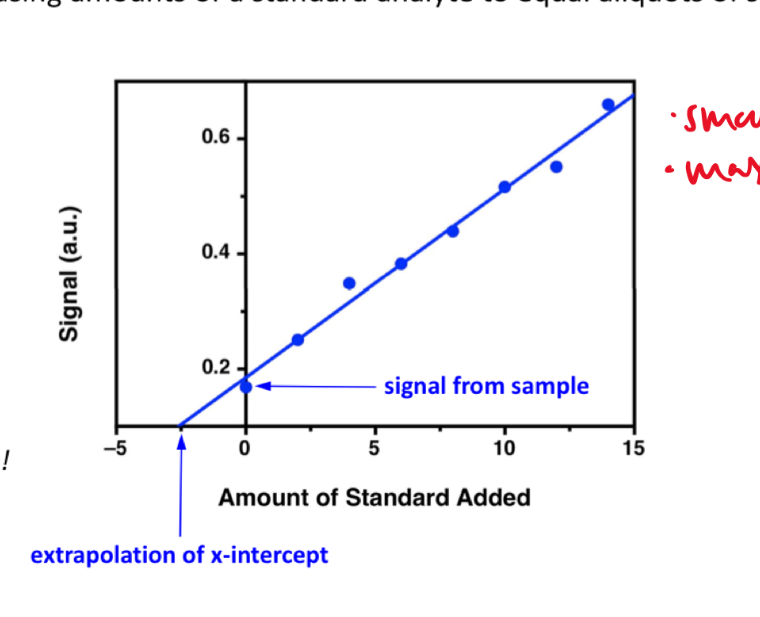
- standard addition: matrix too complex, so use standard addition
- prepare standard solutions but with sample and add analyte to “sample”
- find x-intercept: when y = 0, this is the “original” value of x (without the shift in y axis)
- the linear line has been “shifted” on the y axis
- internal standard: intentionally add substance that is not expected to be found in sample (not the analyte) but behaves similarly
- constant amount of internal standard => constant signal
- changing concentrations of analyte
- plot ratio between analyte and internal standard vs. ratio of their concentrations $$\frac{S_{A}}{S_{IS}}$$ vs. $$\frac{[A]}{[IS]}$$
- Explain the standard addition and internal standard methods of calibration and how they can compensate for certain types of interferences.
- external standard:
- create standard solutions with varying/known conc. of analyte
- interpolate unknown from CC
- can’t account for matrix or inconsistencies in instrument
- standard addition
- add known quantities of analyte to unknown solution
- extrapolate unknown from CC
- accounts for matrix
- internal standard:
- add known amount of different (but similar) compound to unknown and standards
- ratio of signal from analyte to signal from internal standard
- external standard:
- Interpret or create calibration curves based on external standards, standard additions, or internal standards to determine unknown quantities (e.g., analyte concentration in a sample).
- Describe the method of least squares in linear regression
- Apply error propagation and appropriate significant figures in reporting calculated values.
- Explain how a Gaussian distribution represents randomly distributed data and forms the basis for confidence limits and statistical tests.
- gaussian distribution: bell curve
- 1sd: 68%
- 2sd: 95%
- 3sd: 99%
- population vs. sample:
- sample sd approaches population sd as N > 20
- as N increases, sd decreases
- gaussian distribution: bell curve
- Calculate an average, standard deviation, and confidence limits.
- RSD: $$\frac{\sigma}{\bar{x}} \times 100 \%$$
- CI: probability a difference exists when it doesn’t
- 99% is a larger range than 95% (95% covers smaller area under the guassian distribution)
- Select and apply appropriate statistics to test a hypothesis (e.g., comparison of means, comparison of precision, rejection of outliers).
student’s t value: permits use of sample data to test hypothesis without knowing population sd
significance testing: is difference between two values too large to be explained by random uncertainty
case 1 t-test case 2 t test case 3 t-test grubb’s test compare experi. to true compare two experi. results compare two methods outlier? - case 1 t-test: $$t_{exp} = \frac{|\bar{x} - \mu|\sqrt{N}}{\sigma}$$, and then compare, texp > ttable means significant difference
- case 2 t-test (do two experimental values agree with each other?):
- same sd: must pool the sds
- $$\bar{x_1} - \bar{x_2} = +/- t \sigma_{pool} \sqrt{\frac{N_1 + N_2}{N_1N N_2}}$$
- if LHS < RHS: the 2 means are not statistically different
- $$\bar{x_1} - \bar{x_2} = +/- t \sigma_{pool} \sqrt{\frac{N_1 + N_2}{N_1N N_2}}$$
- use f-test to determine if two SDs are statistically different: $$\frac{\sigma^2_1}{\sigma^2_2}$$, find Fexp and compare with table value => then do the work for different SDs
- same sd: must pool the sds
case 3 t-test: paired/matched measurement data
- comparing single measurements made with two methods on several different samples
- before and after (drug trials, same people)
grubb’s test: determine outlier, make sure to remove if it is an outlier
other misc. lecture notes
An Introduction to Analytical Measurements
- signal
- visual detection: simple, low-cost, subjective, not sensitive, large sample volumes, low-throughput (??)
- electrical detection: objective, more sensitive, faster, automate, costly, maintenance, calibration
- voltage
- current
- transducer: converts input stimulus into electrical output
- measurement:
- signal-to-noise ratio: $$\frac{S}{N}$$ is proportional to $$\sqrt{n}$$
- averaged signal S, averaged noise N
- signal-to-noise ratio: $$\frac{S}{N}$$ is proportional to $$\sqrt{n}$$
- controls:
- positive: standard sample with known quantity of analyte
- prevents situation when there should be a signal but there is no signal (false negative)
- negative: standard sample with no analyte
- prevents situation when there should be no signal and there is a signal (false positive)
- positive: standard sample with known quantity of analyte
- sig figs:
- pH: pH of 2.45, digits after decimal are how many sig figs the conc. has
- exact number has infinite number of sig figs
- signal
mt1 problems
unit 1
- detecting signals that are statistically significant: S ≥ μbackground + 3σbackground
- which t-test to use:
- case 1: compare sample mean with population mean (the true value) (needs replicates)
- case 2: use the f-test to compare SD of two sample sets, then compare two sample means (needs replicates)
- case 3: compare methods of single measurements of several different samples
- $$\frac{S}{N}$$ proportionate to $$\sqrt{n}$$
- concentration detection limit: SA = Sbackground + 3σbackground
- what does each standard allow you do to:
- external standard: interpolate unknown from CC
- standard addition: extrapolate unknown from CC (matrix effect)
- internal standard: ratio, add substance similar to analyte, but different and not expected to be found in sample